
Operations Report Guide
Access to Operations Report
To be able to view the Operations Report, you must have the necessary permits and access it through the Report/Operations Report option on the menu.
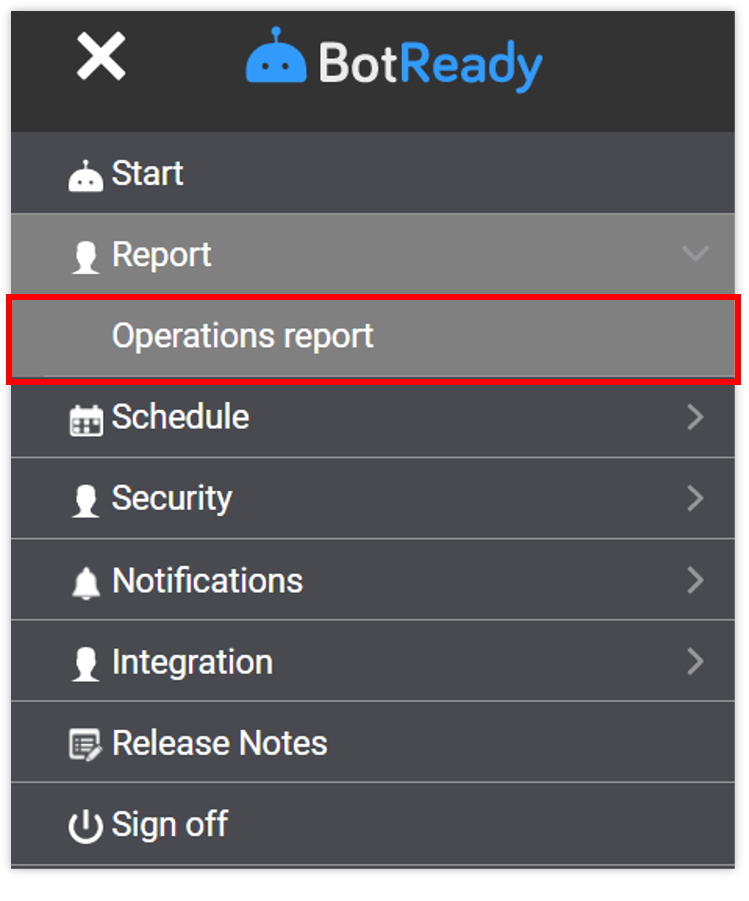
Note: You can find information on how to configure the user permits to access the Operations Report in Section: Administrator Guide - Operations Report
Overview
Robots will have a dashboard type Operations Report, wherein you can monitor the execution behavior, the operation and the FTE (Full-Time Equivalent) metric for a Robot or a set of Robots.

- Report Area: display of interactive graph.
- Filter Area: different filters that will influence the information displayed in the Report Area.
- Views: selection of a view to see Execution, Operations, and FTE reports.
Execution View
Filters

| Field | Description |
|---|---|
| CALENDAR | Selection of a filter by year and month. |
| BOT GROUP | Selection of the Robot group. |
| BOTS | Selection of Robots. |
| EXECUTION STATUS | Possible options: Select All, With Errors, Without Errors |
| EXECUTION TYPE | Possible options: Select All, Manual Completion, Normal Completion. |
Report

| Field | Description |
|---|---|
| BOTS | Number of Robots selected and for which the report has been generated. |
| EXECUTIONS | Total number of executions. |
| AVERAGE OPERATIONS | Operations on average. |
| EXECUTION TIME | Total execution time. |
| MONTHLY EXECUTIONS | Graph showing the number of executions per day in a month. |
| EXECUTION TIMELINE | Graph showing how much time every Robot's execution takes per day in a month. |
Operations View
Filters

| Field | Description |
|---|---|
| CALENDAR | Selection of a filter by year and month. |
| BOT GROUP | Selection of the Robot group. |
| BOTS | Selection of Robots. |
| OPERATION TYPE | Possible options: Select All, SUCCESSFUL, FAILED. |
Report

| Field | Description |
|---|---|
| ** ACTIVE BOTS** | Number of Robots selected and for which the report has been generated. |
| TOTAL | Total number of operations. |
| SUCCESSFUL | Total number of successful operations. |
| FAILED | Total number of failed operations. |
| DAILY OPERATIONS | Graph showing the number of operations per day in a month. |
FTE View
Filters

| Field | Description |
|---|---|
| CALENDAR | Selection of a filter by year and month. |
| BOT GROUP | Selection of the Robot group. |
| BOTS | Selection of Robots. |
Report

| Field | Description |
|---|---|
| OPERATIONS | Number of successful and failed operations. |
| TIME | Time saved thanks to the successful operations, measured based on the time it would take a person to perform them. |
| MONEY | Money saved thanks to the successful operations. |
| MONTHLY FTE | FTE (Full-Time Equivalent) percentage savings. Note: the metric suggests that an FTE value at 1% corresponds to a worker's full work day. |
| ANNUAL FTE | Graph showing the total FTE saved per month in a year. |
Interactive Graphs
The graphs of all the views are interactive; when you click on a sector or a specific bar, the top metrics will be affected and will show the information of the selected sector.
Example in Operations View

Example in Executions View
